Information taken from Arthur Kellerman and Donald Reay's "Protection or Peril? An Analysis of Firearm-Related Deaths in the Home." Printed in The New England Journal of Medicine 314, no. 24 on June 12, 1986; pages 1557 through 1560.
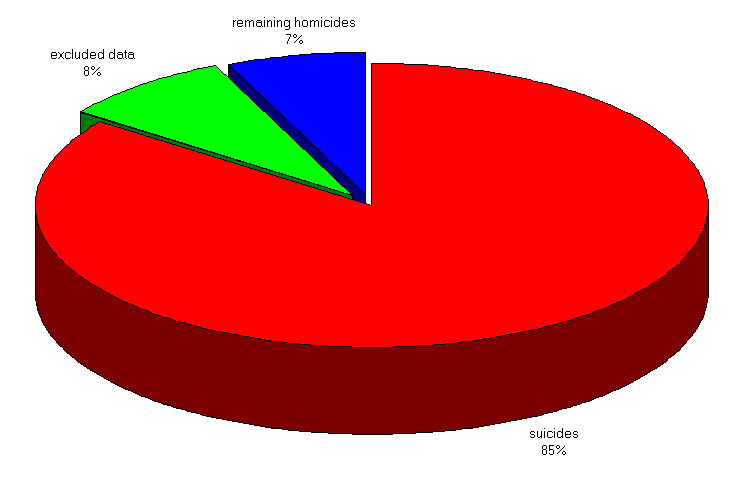
The pie chart at the bottom of this page is a visual representation I created, representing the statistical percentages of the categories of death used by Kellerman and Reay in their oft-quoted 1986 study.
Excluded data (the green slice) is data the study's researchers chose to discard due to it not being confirmable, or for other valid reasons, and represents 8% of the total data collected. This category (excluded data) occurs in most statistical studies, and should not be attributed to 'sinister' motives of the researchers. ;-)
As can be seen, the actual percentage of intentional homicides (excluding suicide) used in the study is only 7% (the blue slice). Unfortunately, that category of deaths (intentional homicide excluding suicide) is what the study purportedly claims all the deaths used in the study represented. Unsurprisingly, the results of the study are accordingly skewed, and thus Kellerman and Reay make their famous and erroneous conclusion that there's something like a 43% higher chance of a violent murder in a house with a gun in it.
Needless to say, that statistic would be far lower -- and less exciting -- if the 85% gun-related deaths that were suicides (the red slice) were excluded.
Interestingly enough, in countries where guns are outlawed people intending suicide are still not deterred -- check out Japan's suicide rate in Table A for a comparison.
Information taken from Arthur Kellerman and Donald Reay's
"Protection or Peril? An Analysis of Firearm-Related Deaths in the
Home." Printed in The New England Journal of Medicine 314, no.
24 on June 12, 1986; pages 1557 through 1560.
Last Updated: Mon, March 30, 1998